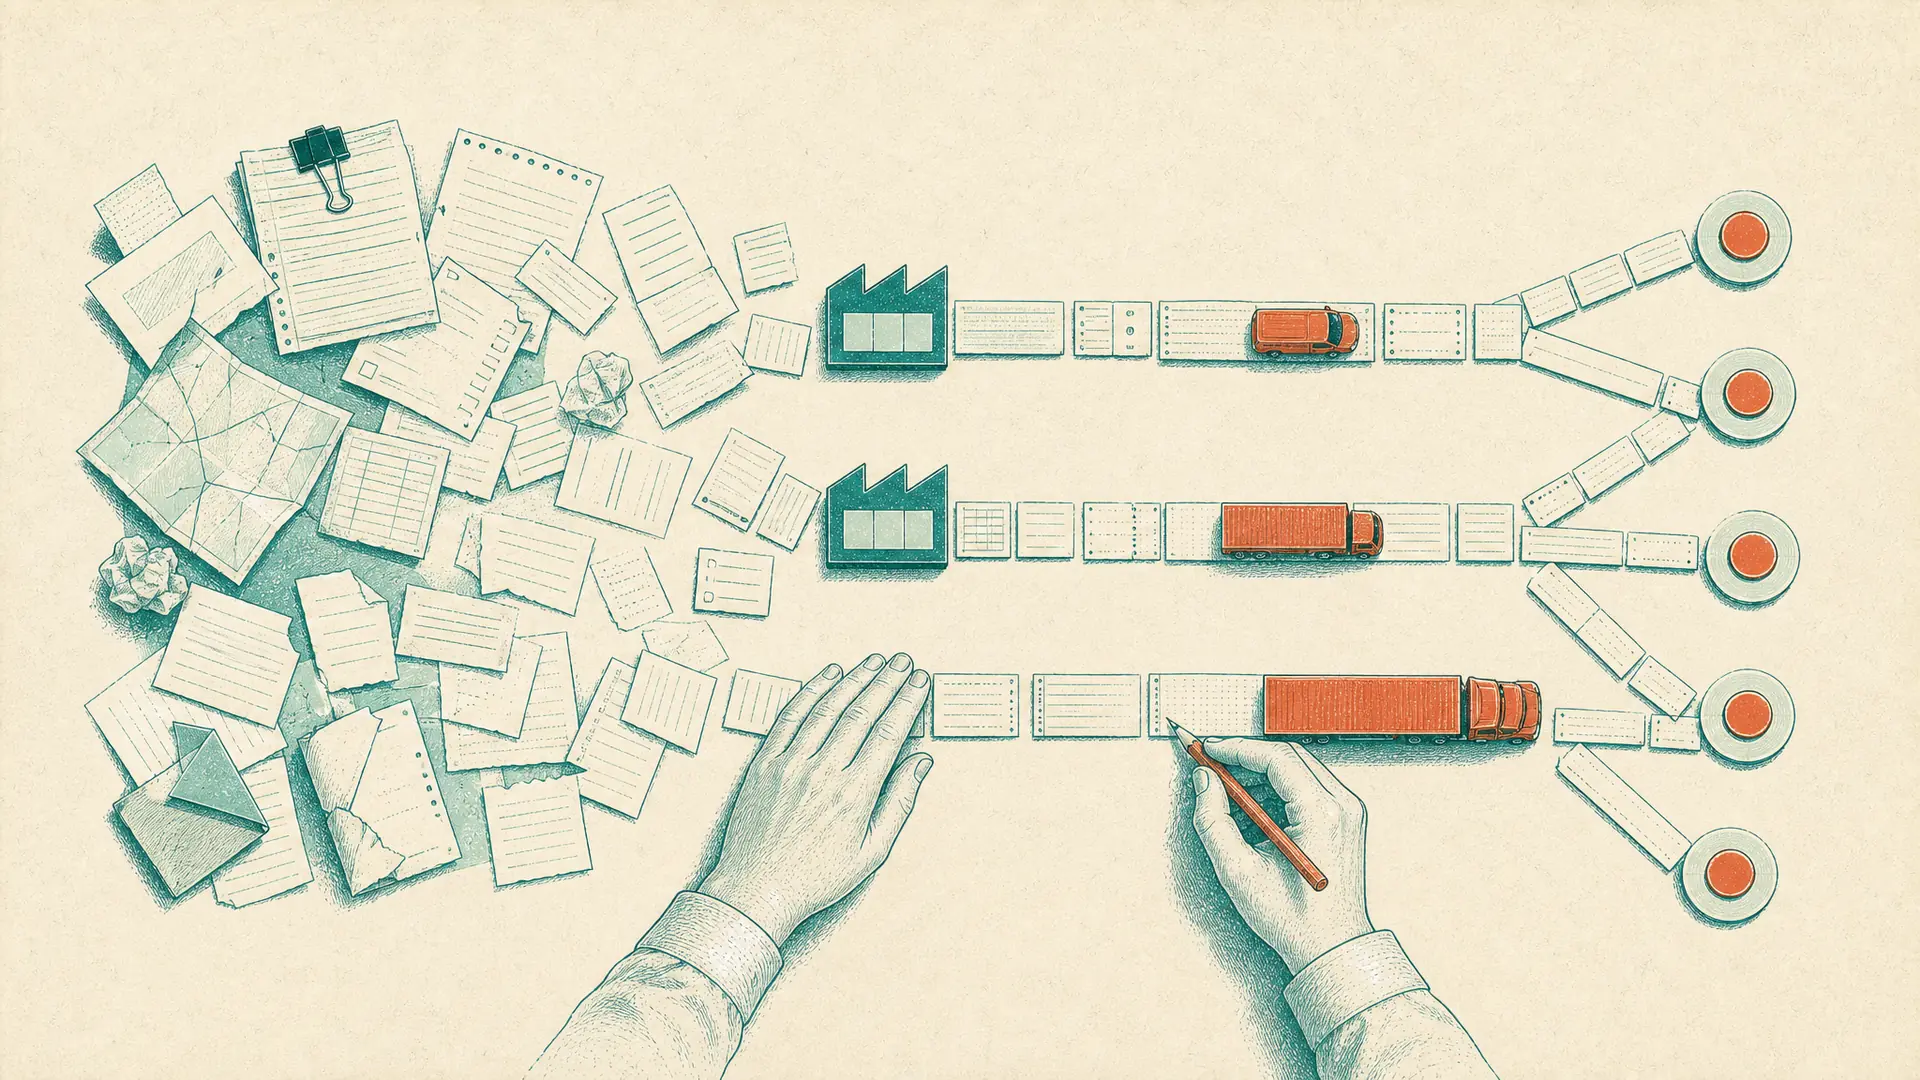
Ask anyone how to start with AI in supply chain and you’ll hear the same thing. First clean your master data. Then build a data platform. Only then start with AI.
It sounds wise. It’s also why so many teams are still waiting. Supply chain data will never be fully clean: carriers quote in different formats, suppliers send PDFs, and every site names things a little differently.
For automated systems, the advice still holds. You don’t want a replenishment run working on broken master data. But for analysis, the one-off questions that eat your team’s week, the advice is getting out of date.
The reason is a new generation of models like Claude Opus 5.5, released by Anthropic on 22 September. It’s built to take a messy pile of inputs, work out what they mean, and hand back finished, checked work. Messy data is no longer the blocker. Unclear questions are.
What Opus 5.5 is
Opus 5.5 is Anthropic’s newest top-tier model, released two months after Opus 5. According to Anthropic, it now beats Fable 5.1, its larger and more expensive flagship, on many tests. And it costs less than the model it replaces.
Under the hood, it’s a large language model that reasons before it answers. What makes it different is not one new trick, but how well it holds together on long, multi-step work: reading, planning, writing code, using tools, checking itself.
The headline capabilities:
- Long agentic work. It can plan and carry out tasks that run for an hour or more. One early tester reports a 680,000-line code migration done in under a day.
- Professional knowledge work. On GDPval-AA, a test of real tasks across 44 occupations, it scores 1846 Elo against 1708 for Opus 5.
- Using a computer. It scores 81.8% on OSWorld 2.0, a test of operating ordinary desktop software by looking at the screen and clicking.
- Reading a lot at once. A context window of 1 million tokens, which is roughly a few thousand pages of text.
- Clearer writing. Anthropic says it puts the most important information first and uses less jargon.
On price, input drops from $5 to $4 per million tokens and output from $25 to $20. Anthropic claims about 40% lower running cost on typical workloads. It’s available in the Claude apps, through the API and on AWS, Google Cloud and Azure.
One caveat before we get excited: all these benchmark figures are Anthropic’s own. They are useful signals, not proof that it works on your data.
What it means for supply chain
The useful question is no longer “can AI do this?” It’s “which part do I hand over, and which part do I keep?” Here’s how I split it:
| Hand over to the model | Keep for yourself |
|---|---|
| Reading every input, in every format | Asking the right question |
| Cleaning, mapping and reconciling the data | Deciding which data it may see |
| Writing and running the calculation code | Checking the assumptions it lists |
| The first draft of the memo or table | The decision, and the accountability |
The left column is where most analysts lose their week. The right column is where their experience is worth the most.
Where this pays off first:
- Forecast error reviews. Read a year of forecasts against actuals and explain where the bias comes from, per product family.
- Supplier scorecards. Combine delivery data, quality notes and email threads into one fair score per supplier.
- Customer claims. Read hundreds of complaint texts and group them into a handful of root causes.
- Master data checks. Compare lead times and prices in the ERP with the latest supplier confirmations.
- Carbon reporting. Combine shipment data and emission factors into a first CO2 estimate per lane.
But you don’t have to take my word for it. Here’s a prompt you can run today.
Try this: a carrier tender in three formats
Transport tenders are a perfect test of the messy data myth. Carriers never quote in the same way. One prices per pallet, one per truck, one per kilometre, and each adds its own surcharges and footnotes. Comparing them usually costs someone half a day in Excel.
The prompt below uses Upshift, a fictional bicycle maker with two plants and five hubs. All data is illustrative. Paste everything into Claude with Opus 5.5 selected. It works best where Claude can run code.
You are a transport procurement analyst at Upshift, a bicycle maker.
We ran a tender for 5 lanes. Three carriers answered, each in its
own pricing format. Help me award the lanes.

Tasks:
1. Normalise every bid to one comparable cost per lane per week in
   EUR, including fuel surcharge.
2. Recommend a carrier per lane and give the total annual cost
   (48 weeks). Compare it with giving all lanes to one carrier.
3. Explain any pattern you see in which pricing model wins where.

Rules:
- Use only the data below. A full truck holds 33 pallets.
- If something is ambiguous, make a reasonable assumption and say so.
- Never drop a bid silently. Flag anything you could not price.
- If you can run code, do the calculations in Python and show it.

Output:
- One table per lane: cost per carrier and the recommended carrier.
- A list of assumptions, and open questions to send to the carriers.
- A five-line summary for the logistics manager.

LANES
lane,distance_km,pallets_per_week
Plant A-Hub North,420,26
Plant A-Hub West,610,18
Plant B-Hub South,380,33
Plant B-Hub East,740,12
Plant A-Hub Central,150,40

BIDS
carrier,lane,price_basis,rate_eur,fuel_surcharge,notes
Velox,Plant A-Hub North,per pallet,48,included,
Velox,Plant A-Hub West,per pallet,61,included,
Velox,Plant B-Hub South,per pallet,44,included,min. 10 pallets per shipment
Velox,Plant B-Hub East,per pallet,79,included,
Velox,Plant A-Hub Central,per pallet,22,included,
Nordtrans,Plant A - Hub Nrth,per FTL,1150,12%,
Nordtrans,Plant A-Hub West,per FTL,1590,12%,excl. tolls
Nordtrans,Plant B-Hub South,per FTL,1020,12%,
Nordtrans,Plant B-Hub East,,12%,rate on request
Nordtrans,Plant A-Hub Central,per FTL,520,12%,
CargoLine,Plant A-Hub North,per km,2.35,8%,
CargoLine,Plant A-Hub West,per km,2.30,8%,
CargoLine,Plant B-Hub South,per km,2.40,8%,
CargoLine,Plant B-Hub East,per km,2.20,8%,max 2 deliveries per week
CargoLine,Plant A-Hub Central,per km,2.60,8%,minimum charge 450 EURWhat you should see
- The typo “Hub Nrth” mapped to Hub North, without being asked.
- The Central lane needing two trucks a week, because 40 pallets don’t fit in one.
- CargoLine’s minimum charge applied on the short Central lane.
- Nordtrans flagged on the East lane (no rate, and one field missing) and on the West lane (tolls excluded).
- A split award rather than one winner, with a clear pattern. Per-pallet pricing tends to win on part loads, per-kilometre pricing on full trucks.
- Sensible questions for the carriers, such as whether the per-kilometre rate covers one way or the round trip.
Why this shows the model’s power
The raw numbers (48, 1,150, 2.35) look comparable, but they aren’t. Weaker models often compare them directly, skip the bid with the missing rate, or slip in the arithmetic. Here the model has to understand three pricing logics, repair the data, calculate correctly and explain what it assumed.
That’s the real shift. Half a day of spreadsheet work becomes ten minutes of reviewing. Your procurement lead spends the saved time on the part no model can do: negotiating the open questions with the carriers.
What it can’t do, and the traps
- Messy is fine, wrong is not. The model can repair formats and typos. It can’t know that a rate card is from last year. Outdated input still gives you a confident, well-written, wrong answer.
- Read the assumptions, not just the answer. One wrong assumption, such as a one-way rate read as a round trip, can flip an award. The assumptions list is where your review time should go.
- Benchmarks are not your business. The scores above are Anthropic’s own, and Anthropic writes that catching every failure before release “remains an unsolved problem”. Rerun your last tender, where you already know the answer, and compare.
- It’s the wrong tool for volume. For thousands of small decisions per hour, a smaller or specialised model is faster and cheaper. Opus is for the hard, one-off thinking.
- Mind your data. Check which account you use and what retention terms apply before you paste real rates or customer data. Anthropic offers zero data retention for business use.
Your move
Every team has one analysis it keeps postponing “until the data is clean”. This week, run the prompt above. Then take that postponed analysis, write the question down as clearly as you can, and hand over the data as it is.
You’ll learn more in one hour than in a year of waiting for the perfect data platform. And you’ll find out where your data really needs fixing, because the model will tell you what it had to assume.
The supply chain people who win the next few years won’t be the ones with the cleanest data. They’ll be the ones who ask the sharpest questions.
So tell me: which analysis have you been postponing until the data is clean?